Personal AI observability
Claude usage dashboard
Knowing what I'm actually spending
I use Claude Code daily — sometimes for hours. Without observability, I had no idea how many tokens I was burning, which projects were costing the most, or whether my workflow was efficient. So I installed a third-party dashboard, hit a wall when it rendered blank, fixed the bug, then customized the whole thing to match my portfolio and added true-live auto-rescan so it updates as I work.
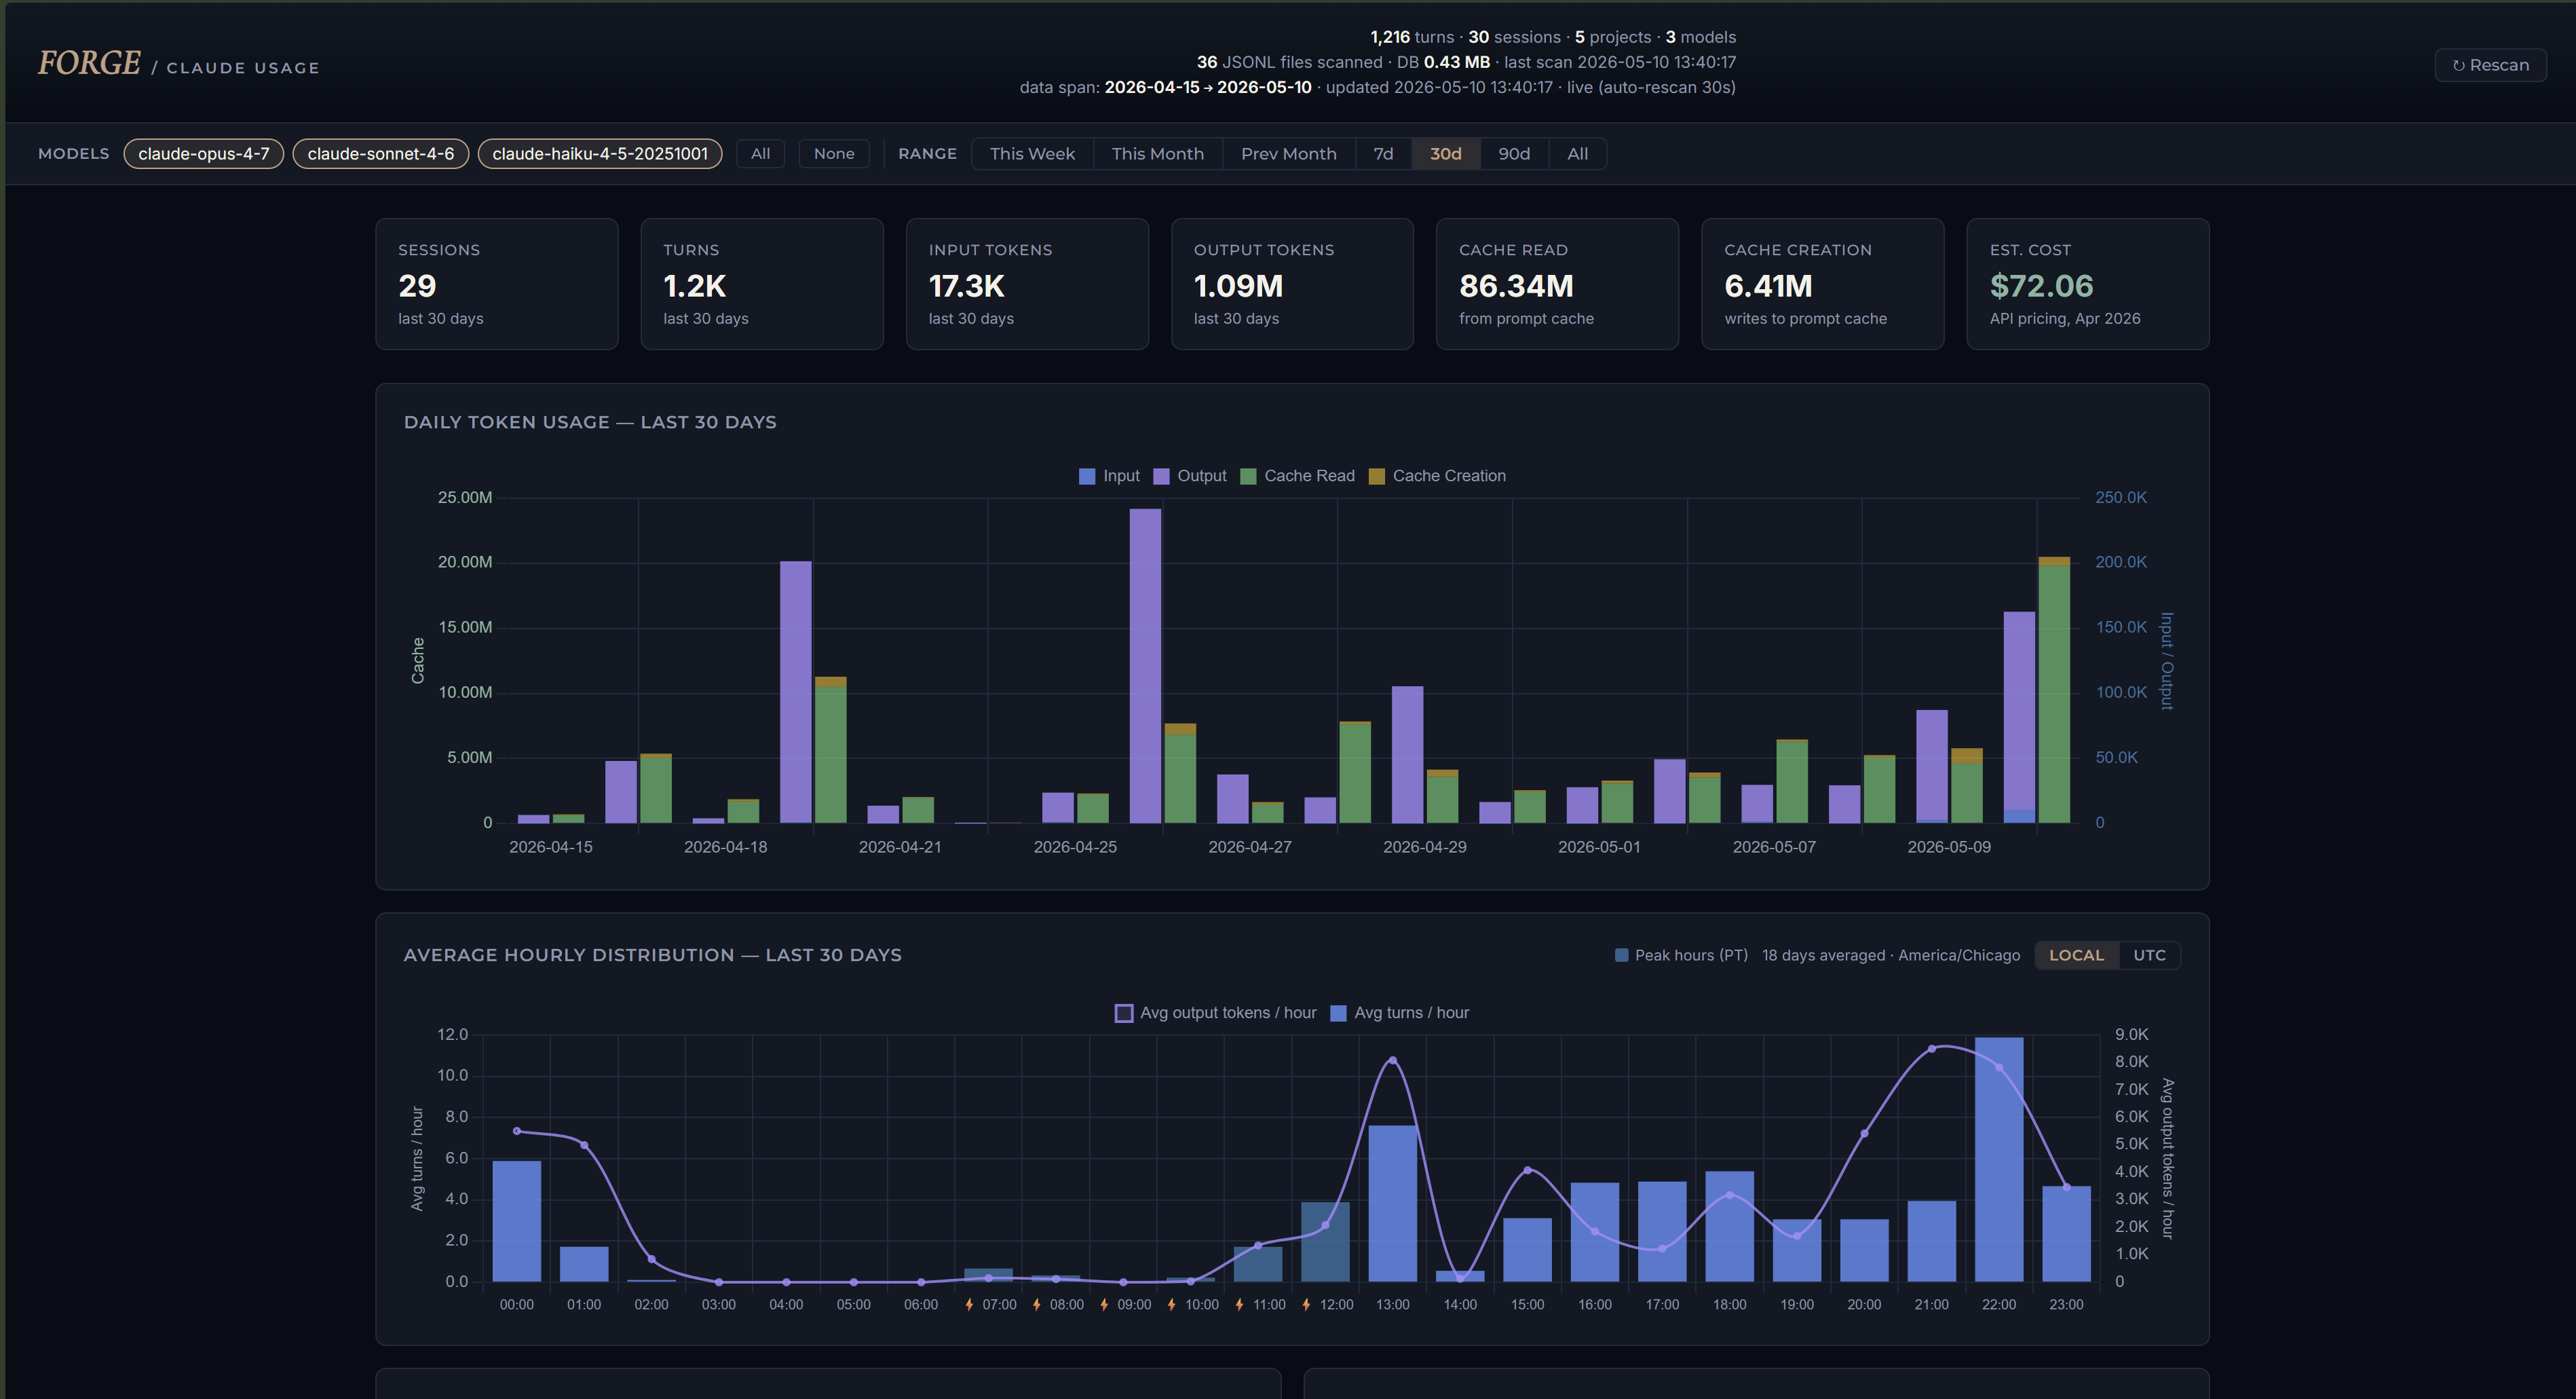
The dashboard is a single Python script with zero dependencies — just stdlib (sqlite3, http.server, pathlib) and Chart.js from a CDN. It reads Claude Code's local JSONL transcripts at ~/.claude/projects/, parses them into a SQLite database at ~/.claude/usage.db, then serves an HTML dashboard on localhost:8080 with token usage, cost estimates, model breakdowns, hourly distribution, and session history.
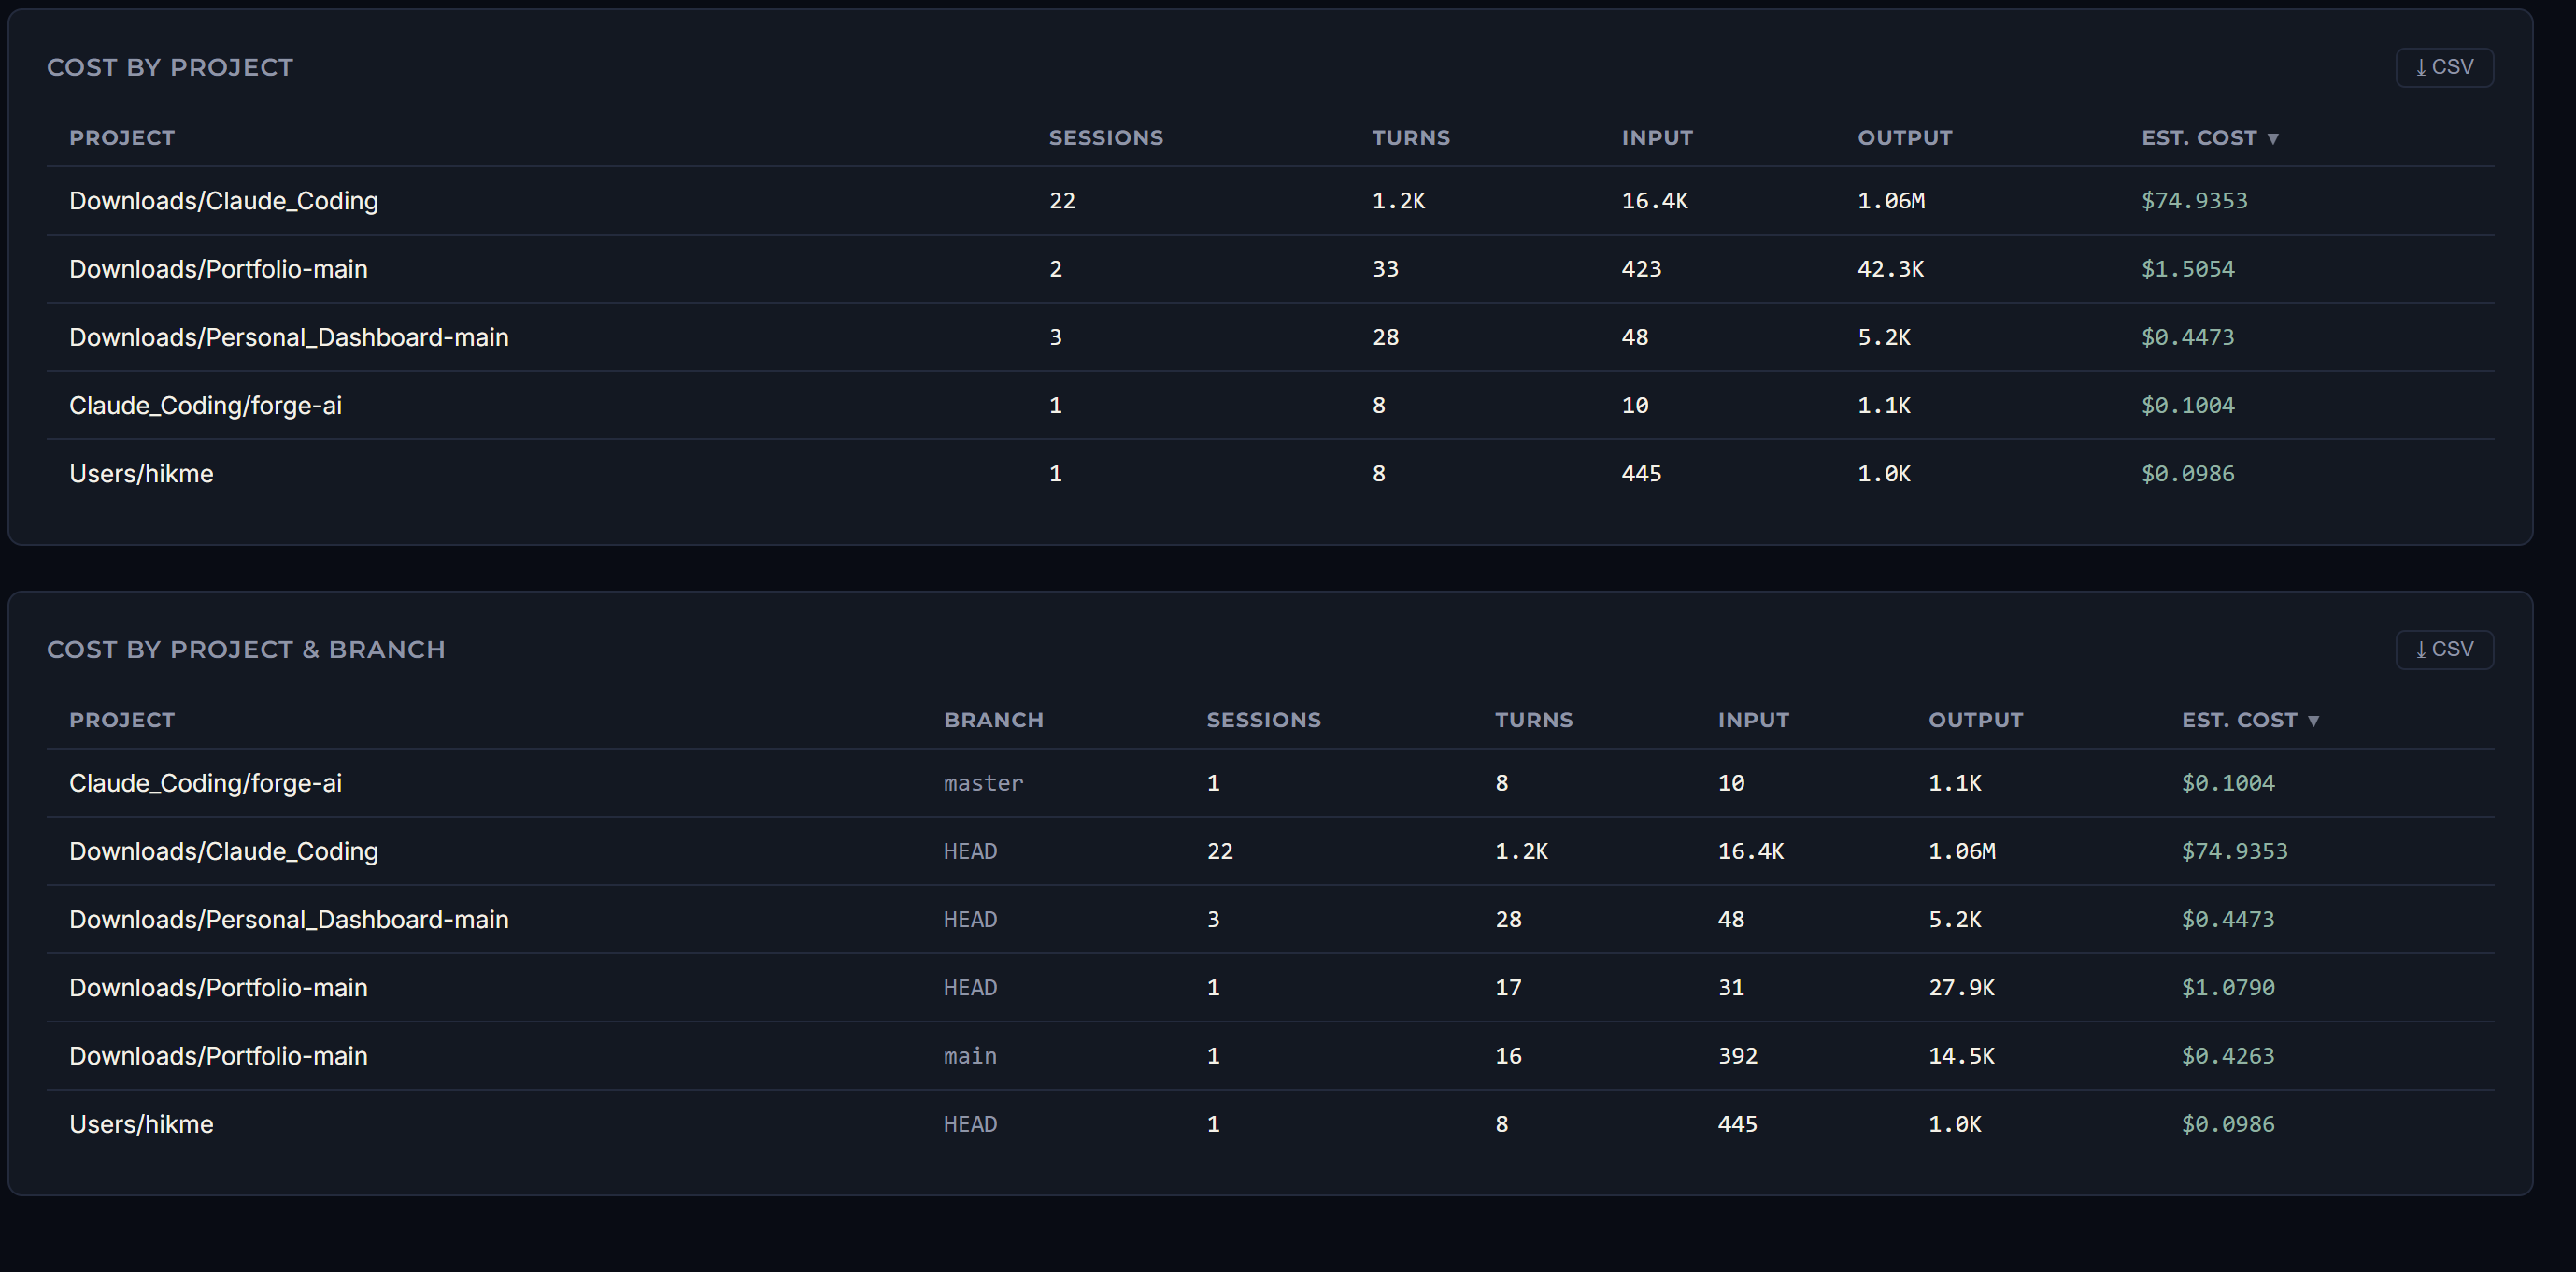
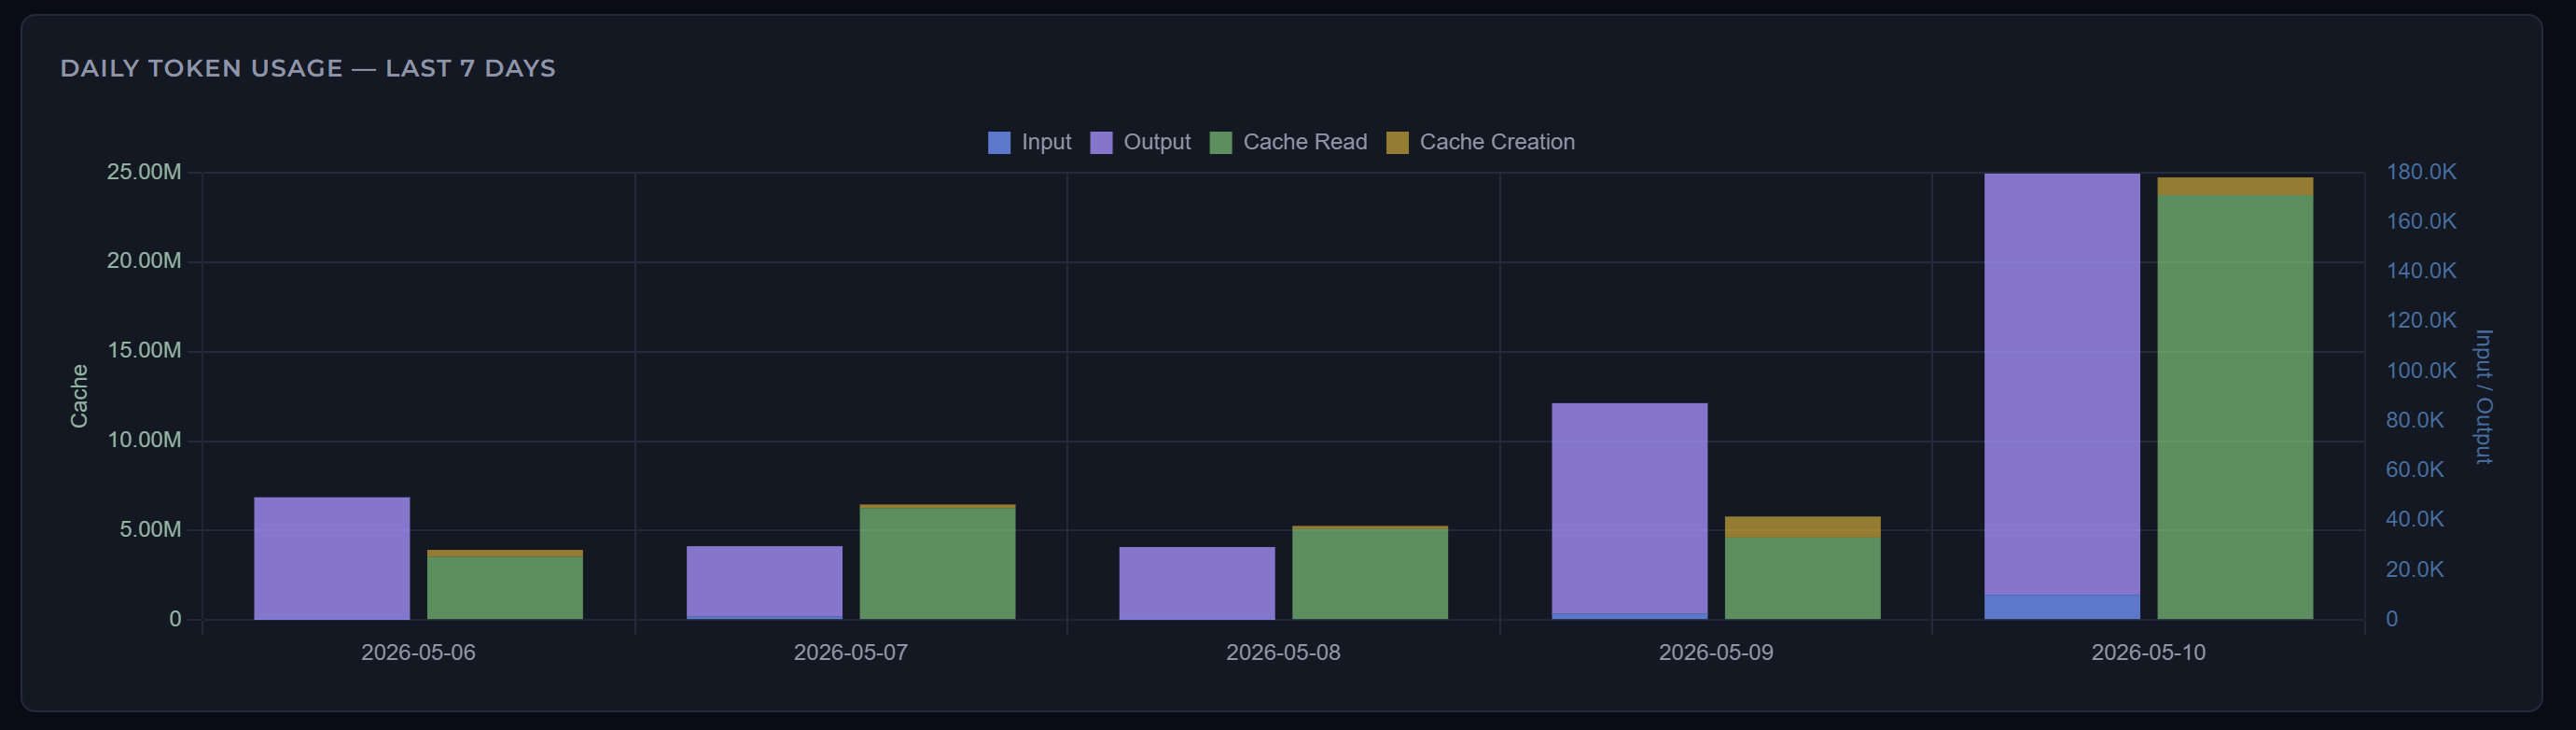
What it shows me right now: 1,216 turns across 30 sessions, 1.09M output tokens, 86.34M cache reads, ~$72 in API-equivalent cost over the last 30 days — Sonnet doing 79% of the work, Opus handling complex sessions, Haiku for fast tasks. Top project by token volume: Downloads/Claude_Coding (where most of my dev work happens).
What I contributed
- Critical bug fix —
dashboard.py:745referenced an undeclared variablecutoff. The error got swallowed by an outer try/catch inloadData(), killing all renders silently — blank stats row and 4 empty chart cards even though the database had real data. Single-line fix: changed the filter to use the samestart/endvariables as line 662. Took 3 minutes of debugging, instant unblock. - Dark theme retrofit — rebuilt the entire color palette:
--bg: #070C14,--card: #0F1822,--accent: #C9A084(gold),--steel: #1C6FA3. 8-tone donut palette for the model breakdown. Red→steel gradient for the peak-hour bar. - Typography — swapped the default fonts for Inter (body), Montserrat (UI labels), and Cormorant Garamond italic for the brand wordmark.
- Header rebrand — "Claude Code Usage Dashboard" → FORGE / Claude Usage. Title tag, header strip, everything aligned with the FORGE AI brand.
- True-live auto-rescan — built a new endpoint
POST /api/scan-incrementalthat runs the scanner without deleting the database. The 30s auto-refresh now hits incremental scan first, then loads data — so live Claude session turns appear within ~30 seconds of being written. - Backend system metadata — extended
get_dashboard_data()to return asystemblock with DB path, size, mtime, total turns/sessions, oldest/newest record, unique projects, JSONL count, model count. All surfaced in the header meta strip. - Default range — changed from 30d to 7d (more useful daily-view default).
The full data flow is: Claude Code writes JSONL to ~/.claude/projects/ on every session (always, regardless of whether the dashboard is running). The scanner parses JSONL into a normalized SQLite schema. The dashboard reads from SQLite, not from JSONL — keeping it fast even with hundreds of sessions. Cowork sessions aren't captured because they're server-side and don't write local logs.
One nuance worth noting: the cost estimates use Anthropic's API pricing as of April 2026. Pro and Max subscriptions are flat-fee, so the dollar figure represents "what the API would cost" rather than actual spend. Useful for understanding usage patterns, not for billing. I treat it as a relative metric — am I burning more this week than last? Which project is the heaviest? That's what matters.
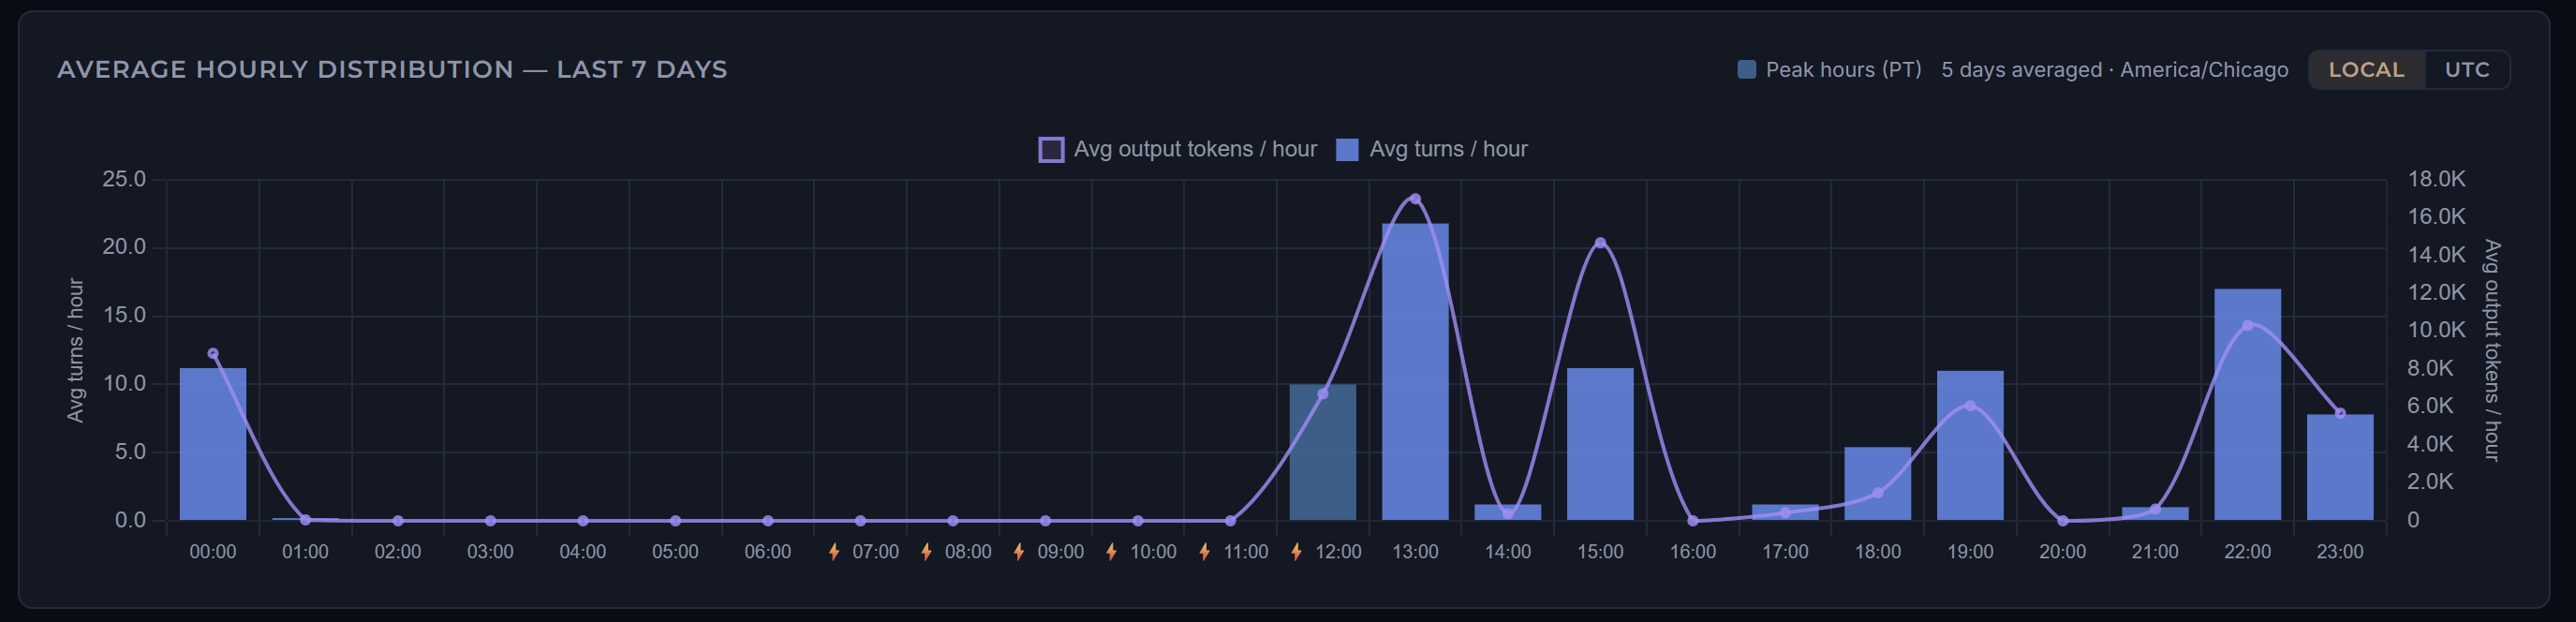
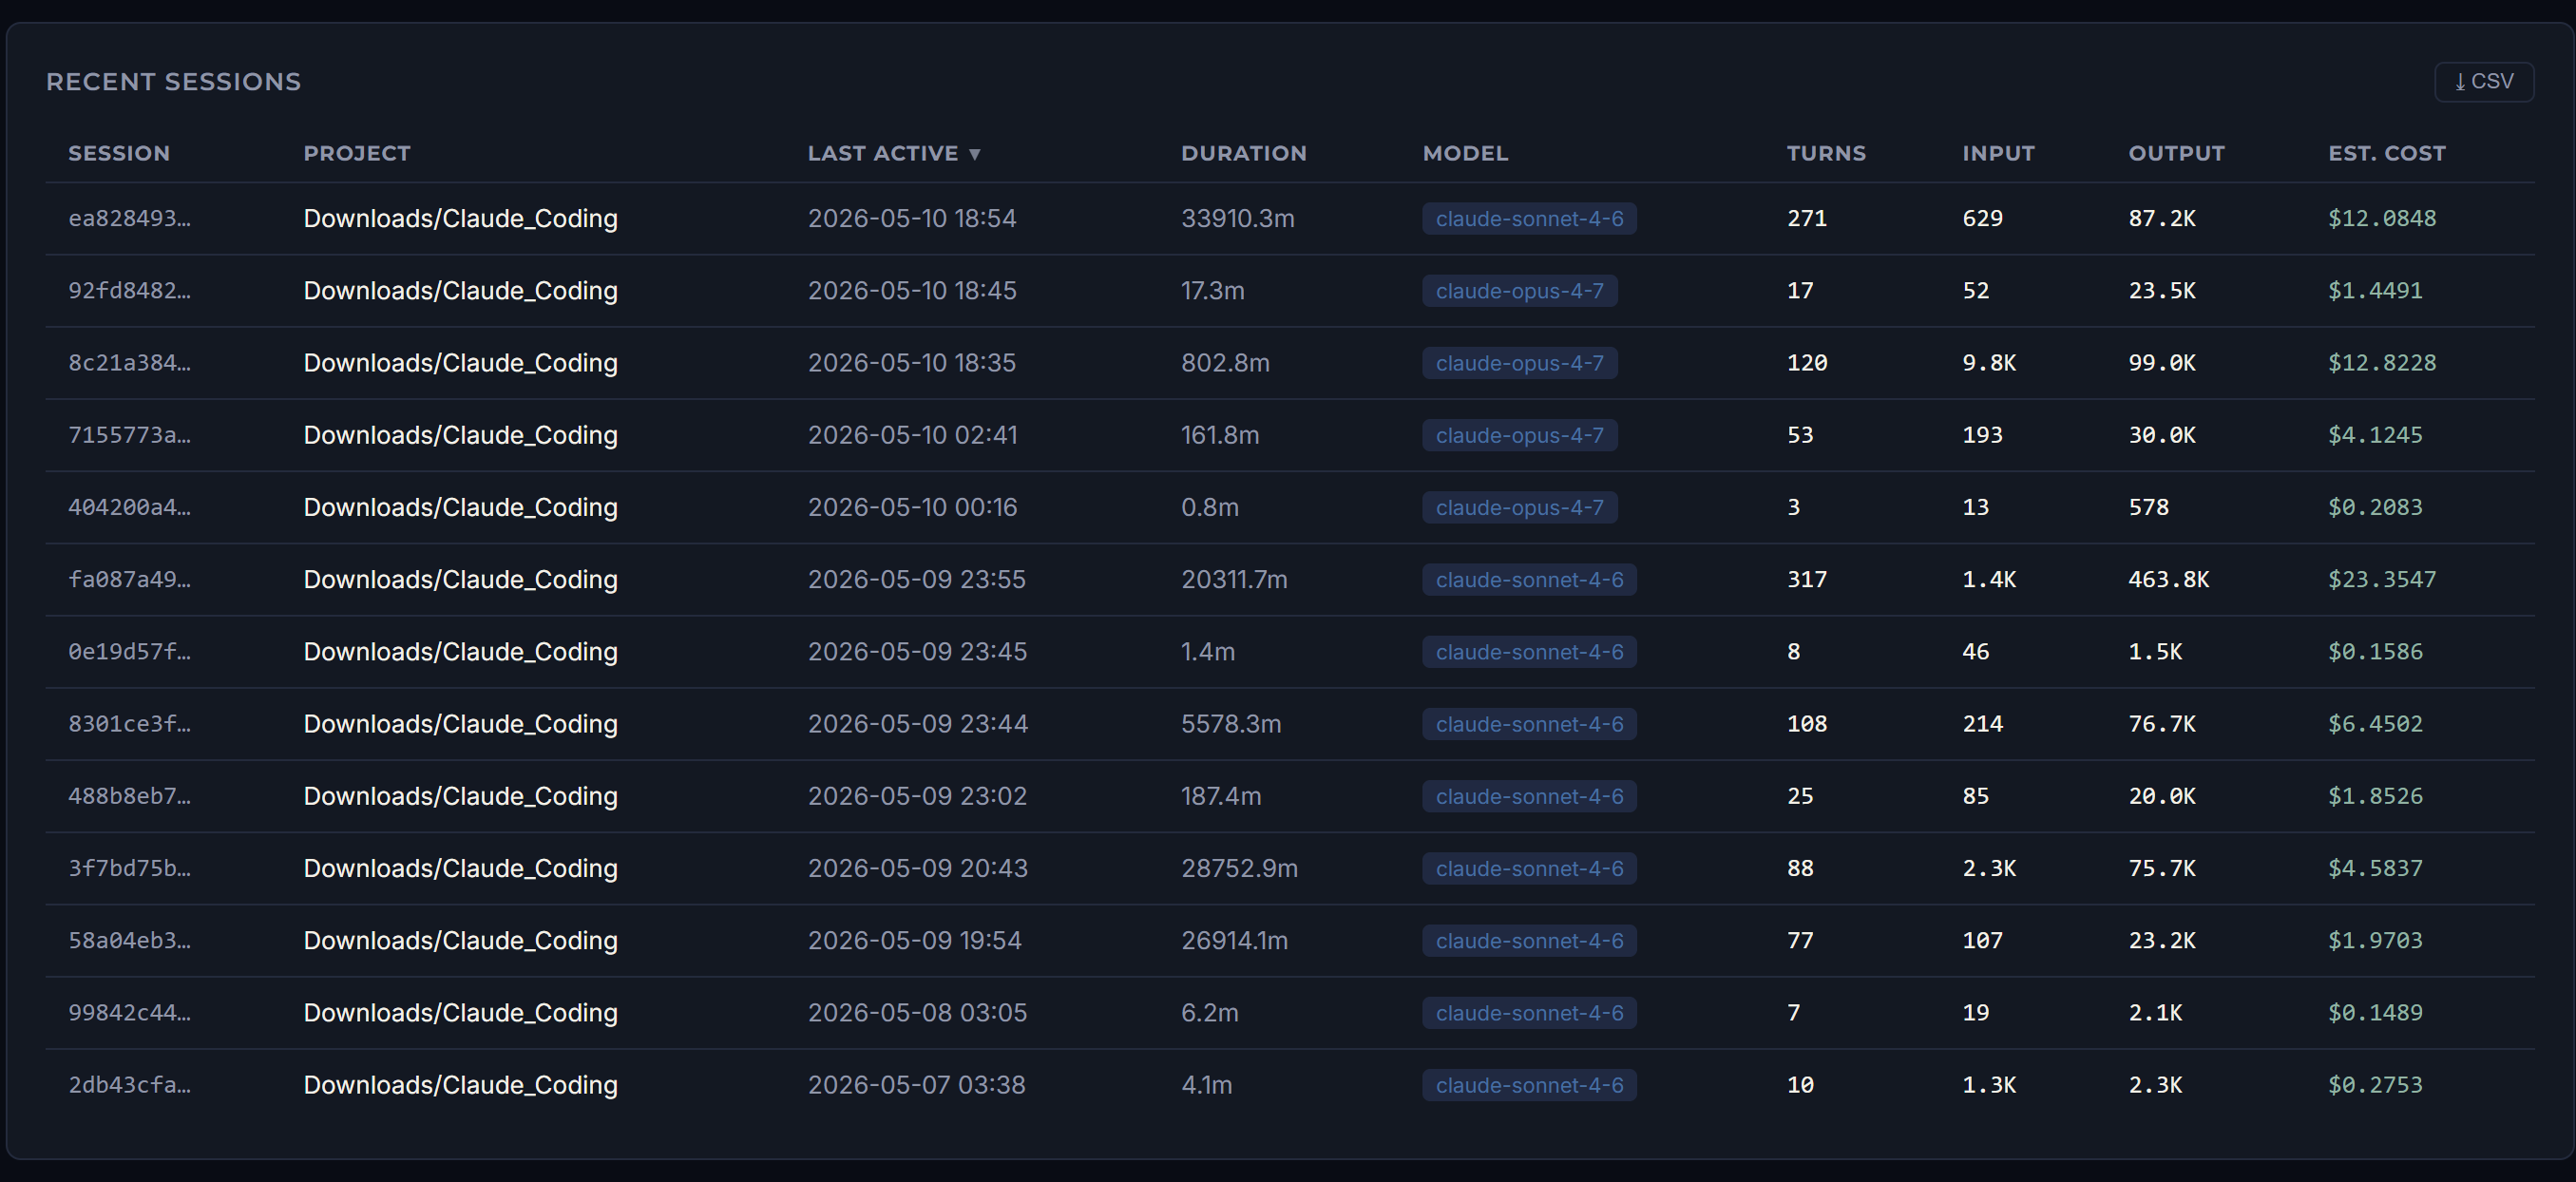
Active — running locally · auto-rescan every 30sReal screenshots from the dashboard running on localhost:8080 — dark theme retrofit, true-live auto-rescan every 30 seconds, reading directly from ~/.claude/projects/*.jsonl.